
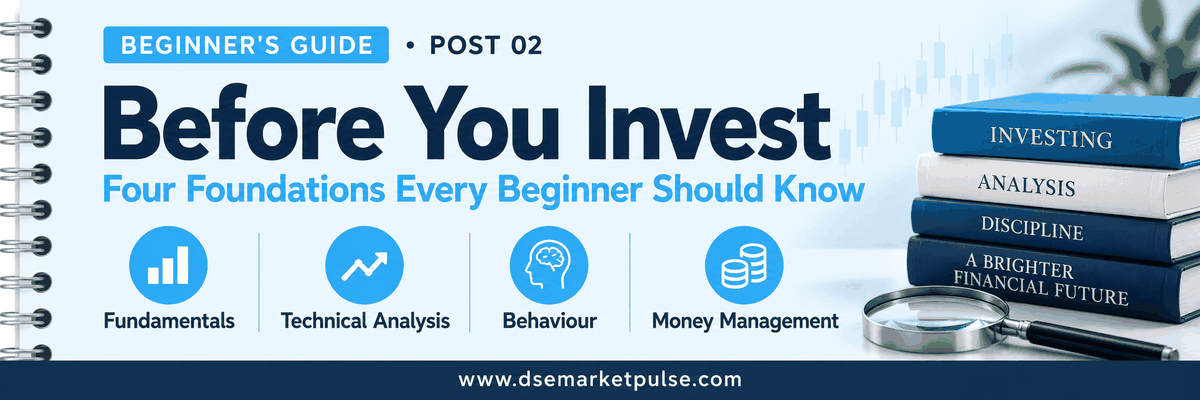
Before You Invest: Four Foundations Every Beginner Should Know
Imagine opening your trading app for the first time. A share price is moving up, someone in a Facebook group says it will go higher, and you worry that waiting means missing an opportunity.
You know how to press Buy. But do you know what you are buying, why the price is moving, what is influencing your judgement, or how much you could lose?
These questions matter before your first investment. In the first post of our Beginner’s Guide, we explored why investing in Bangladesh’s capital market can add value to your financial life. This next step is about preparing to make decisions for yourself.
You do not need to master every financial ratio or chart indicator before you begin learning. Start with four foundations: fundamental insights, technical analysis, behavioural insights, and money management. Together, they help you understand the business, read the market, recognise your own reactions, and manage your exposure.
Fundamental Insights: Understand the Business Behind the Share
When you buy a share, you become a part-owner of a business. Fundamental analysis means examining that business, its financial position, and the price you are being asked to pay for ownership.
Think about buying a small shop with a friend. You would probably ask what it sells, whether customers keep returning, how much profit it makes, and whether it owes money. Buying shares deserves the same curiosity.
Begin with the business model. What does the company sell, who pays for it, and what could help or hurt demand? A business may also be affected by competition, borrowing costs, imported raw materials, exchange rates or energy supply. The relevant factors depend on its industry.
Then look at financial performance. Revenue tells you about sales. Profit tells you what remains after expenses. Operating cash flow helps you examine whether the company’s operations are generating cash. Read these together and across several reporting periods. One strong quarter rarely tells the whole story.
Debt, management quality, and disclosures also matter. Can the business meet its obligations? Are its reports understandable? Does the auditor highlight issues that need attention?
Finally, consider valuation. A strong company can still be an expensive investment at an excessive price. Measures such as earnings per share (EPS), price-to-earnings (P/E), and net asset value (NAV) can help frame questions, but none provides a complete answer alone. For example, a low P/E may reflect uncertainty about future earnings rather than an overlooked bargain.
For Bangladesh-listed companies, begin with exchange disclosures and the company’s own annual reports, financial statements, and price-sensitive information. Check reporting dates and compare the underlying documents rather than relying on an isolated screenshot.
Your First Practical Task
Choose one company and explain, in three sentences, how it earns money, what could weaken its performance, and what evidence supports your view. If you cannot explain the business yet, keep researching.

Technical Analysis: Understand What Price and Volume Are Showing
Even after identifying a business you like, you still face a market price. That price changes as buyers and sellers respond to information, expectations and their need to trade.
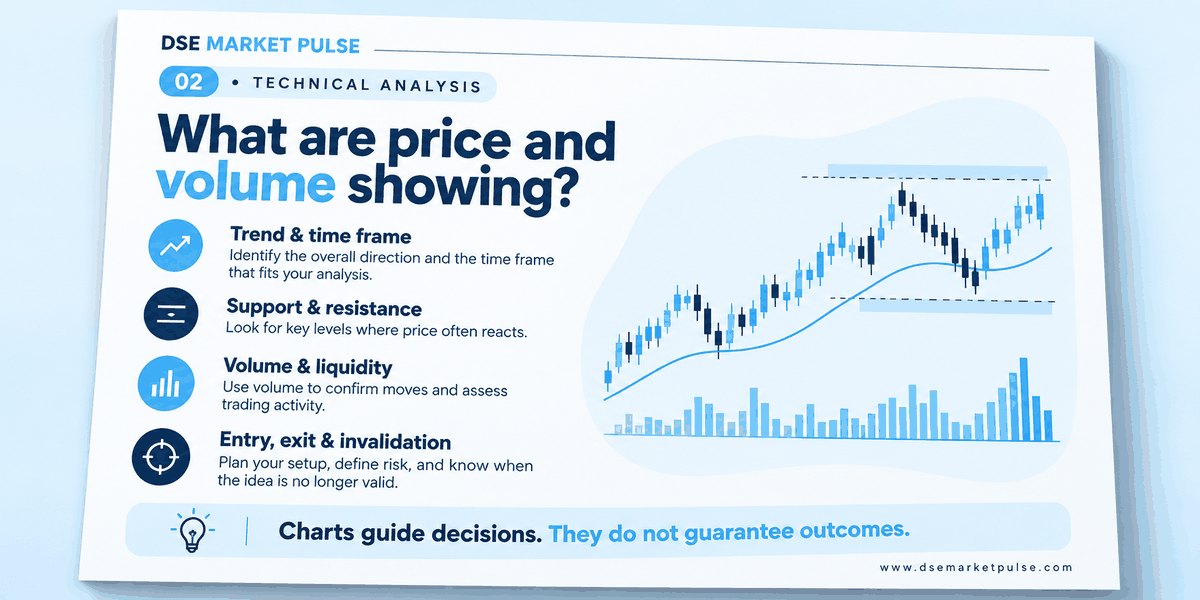
Technical analysis studies market data, particularly price and volume, to assess trading behaviour and possible scenarios. Start with a few basic questions. Is the price generally rising, falling or moving within a range? Does trading volume support the move? How easily could you buy or sell the amount you intend to hold?
Learn the difference between a trend and a single day’s movement. Support and resistance are areas where buying or selling interest has appeared before; they can fail. The time frame also matters. A daily chart and a weekly chart may show different parts of the same story.
Suppose a company’s results look encouraging, but its share price has already risen sharply. A chart may help you recognise that the market has moved ahead of your research. It does not tell you with certainty whether the next move will be up or down.
Use technical analysis to organise decisions: what you are observing, what would support your interpretation, and what would show it was wrong. Charts cannot guarantee a return or repair a weak business.
Your Second Practical Task
Observe a daily and weekly chart of the same share. Describe the trend and volume in plain language before adding indicators. Treat the exercise as observation, not a buy signal.
Behavioural Insights: Recognise the Investor Making the Decision
Now imagine that the share you were studying rises before you buy it. Suddenly, your careful questions feel less urgent. You feel an urge to catch up.
That reaction is part of investing too. Behavioural insights help you recognise how emotions and mental shortcuts can influence financial decisions.
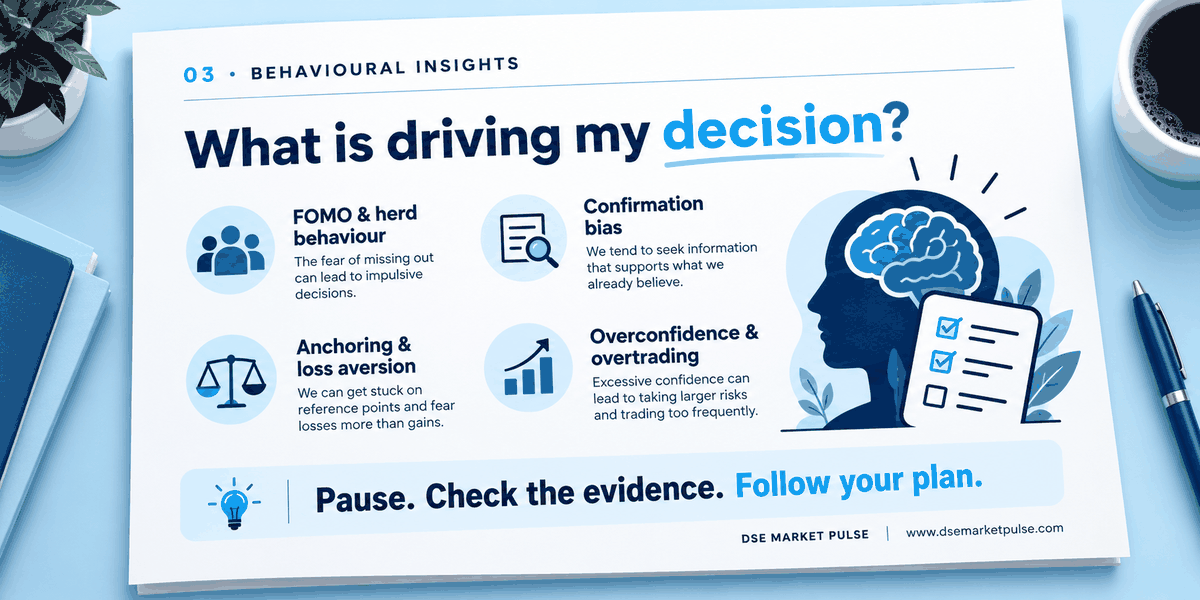
Fear of missing out can make someone chase a rising price. Herd behaviour can make a popular opinion feel like reliable evidence. Confirmation bias can lead you to search for positive news while dismissing information that challenges your view.
Anchoring happens when one number, such as your purchase price or an old market high, dominates your judgement. Loss aversion can make accepting a loss especially uncomfortable. Overconfidence after a few profitable trades may tempt you to increase exposure before you have tested your process across different conditions.
These patterns do not mean you lack intelligence. They mean your decisions need a repeatable process. Write down your reason for considering an investment, the evidence against it, and the conditions that would make you reconsider. Revisit those notes before responding to a rumour or a sudden price movement.
Your Third Practical Task
Before any order, answer: “Would I still consider this investment if nobody around me was discussing it?” Then name one fact that could prove your reasoning wrong.
Money Management: Decide Your Exposure Before Your Entry
In this guide, money management means managing the money you commit to investments and the risks you accept. Research can improve a decision, but it cannot remove the possibility of loss.
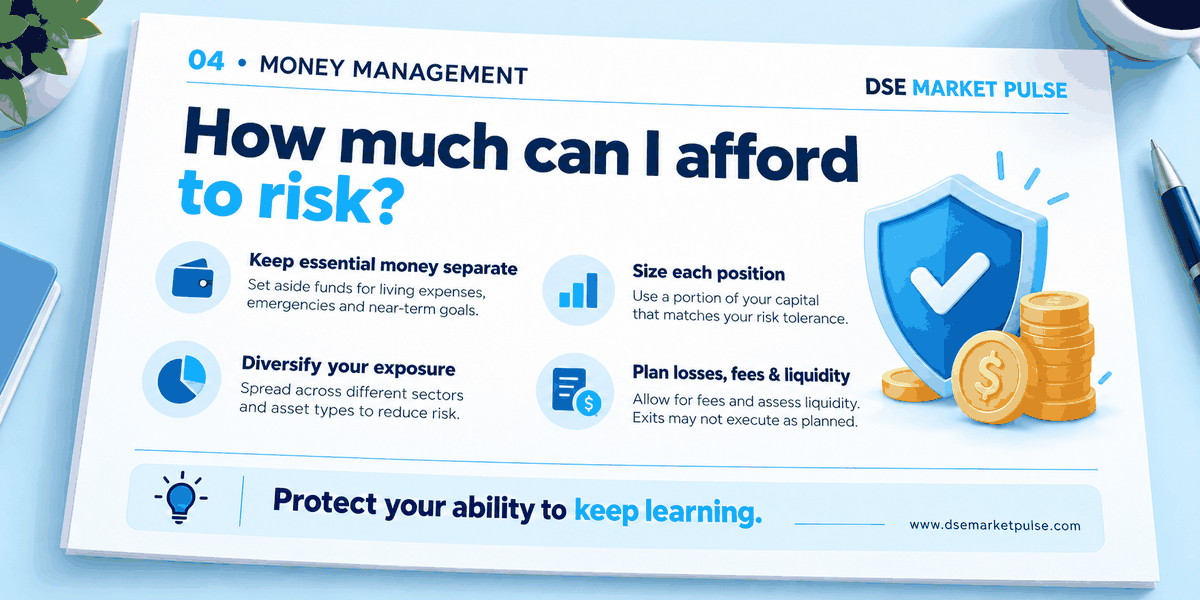
Start with money you can leave invested for your intended time horizon. Keep essential expenses and emergency needs separate. Your ability to bear losses depends on your financial circumstances as well as how comfortable you feel with uncertainty.
Next, distinguish position size from planned risk. Position size is the amount invested in one holding. Planned risk is the loss you estimate under a specified exit scenario. They are different numbers.
For illustration only, suppose an investor has Tk 100,000 set aside for investing. They consider buying 250 shares at Tk 50, a position costing Tk 12,500 before charges. If their planned exit is Tk 48, the price difference implies a planned loss of Tk 500 before charges. That calculation is an example, not a recommended allocation or risk limit.
The actual loss could be larger. A price gap, limited buyers, trading restrictions or delayed execution can prevent an exit at the expected price. A written exit plan does not guarantee that a trade will execute there.
Also consider concentration. Several holdings in businesses exposed to the same industry risk may provide less diversification than their number suggests. Diversification can reduce some risks, but it cannot prevent all losses. Fees and other applicable charges also affect the result you keep.
Your Third Practical Task
Write down how much you intend to invest, the amount in each holding, how much loss you could absorb, and what you would do if your original reasoning changed. If you cannot explain the exposure, reduce it or keep practising without committing money.
Bring the Four Foundations Together
Return to that first trading-app screen. This time, you have a different set of questions.
You understand how the company earns money. You have checked its disclosures and considered the price. You can describe the trend and trading activity without assuming the chart predicts the future. You recognise whether excitement or fear is rushing your decision. And you have decided how much of your money to expose before placing an order.
You may still decide to wait. That can be a useful outcome of research.
Before your first investment, use this short checklist:
- Can I explain the business and the main risks to its earnings?
- Have I checked current disclosures and considered valuation?
- Do I understand the price trend, volume, and liquidity?
- Am I following evidence or reacting to excitement, fear or social pressure?
- Does this position fit my finances, time horizon and loss capacity?
- Have I written down what would make me review or exit the investment?
You will develop each skill over time. For now, the aim is to build a habit of asking better questions before committing money. A path towards long-term wealth starts with decisions you can explain, review and improve.
Continue the Series: Our next guide will introduce the websites, apps and information sources that can help you research Bangladesh’s stock market independently.
Read the first post: Why Invest in Bangladesh’s Capital Market?
This article is for investor education. Examples are hypothetical and are not recommendations to buy or sell securities.



Leave a comment
Please login to leave a comment or reply.